Can AI Detect Kubernetes Failures Before They Happen?
Learn how AI can predict Kubernetes failures before they happen, what signals it uses, where it helps in production, and where human judgment is still required.
People often ask whether AI can detect Kubernetes failures before they become visible to users. The most accurate answer is that AI can help surface early warning signals, correlate telemetry, and rank risk earlier than a human could by inspecting metrics one by one. That is useful, but it is not the same as guaranteed prediction.
In Kubernetes, most failures leave a trail first: rising pod restarts, slower readiness, node pressure, noisy rollouts, storage delays, or unusual scheduling behavior. A practical AI layer looks for those patterns and helps a team decide whether the rollout should continue, pause, or roll back.
This article explains what that kind of assistance really means, where it helps, where it falls short, and how it fits with the NebuaCloud model of observability, GitOps, and bounded remediation.
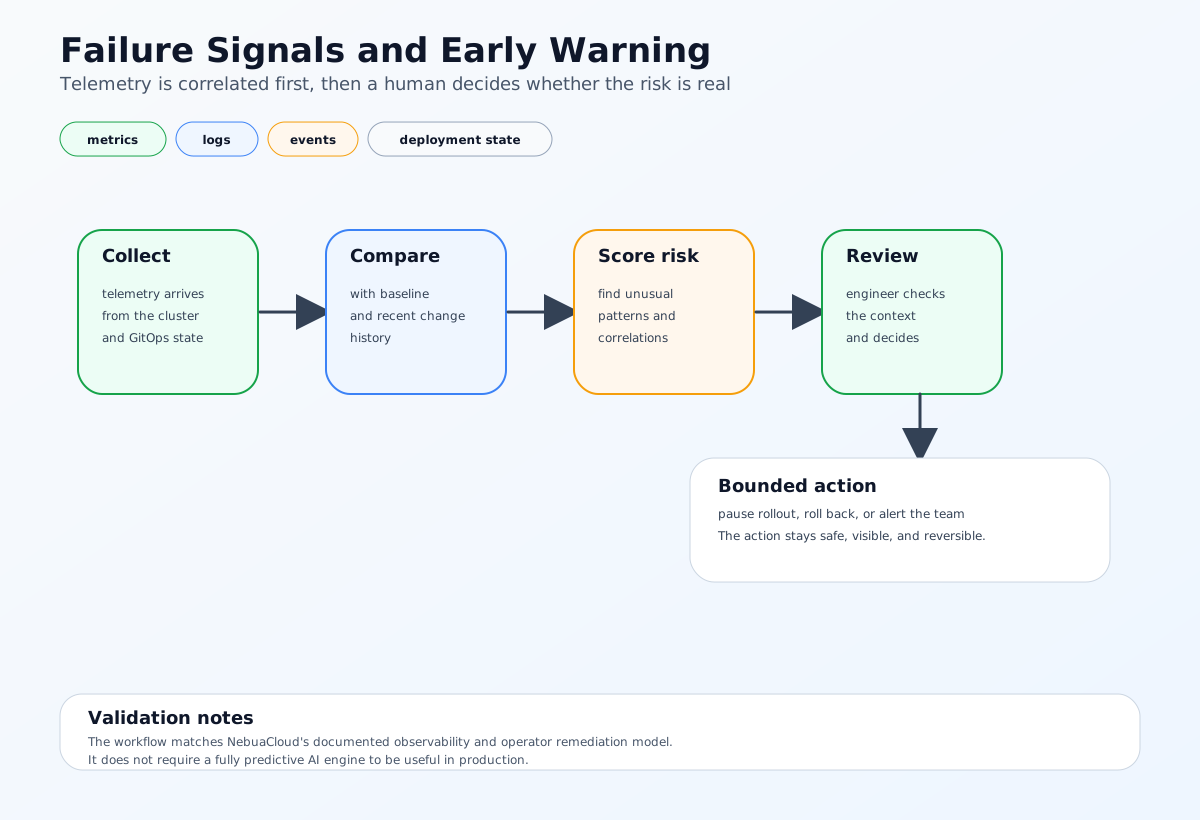
The Problem: Kubernetes Failures Usually Start as Small Signals
Production failures rarely appear all at once.
Before an outage, a cluster may show subtle changes:
- Pod restarts increase
- Readiness probes fail more often
- Latency drifts upward
- A node begins to saturate
- A rollout takes longer than usual
- Errors rise in one namespace or region
These signals are easy to miss when a team is watching several clusters and services at once.
Why the problem is hard
It is easier to detect that something is wrong than to know that something will fail soon.
That is because:
- Many incidents look similar early on
- Every workload has its own normal baseline
- Some issues come from capacity, others from code, configuration, or dependencies
- A single metric usually does not tell the whole story
What AI-Based Failure Detection Actually Means
In production, this usually means one of three things.
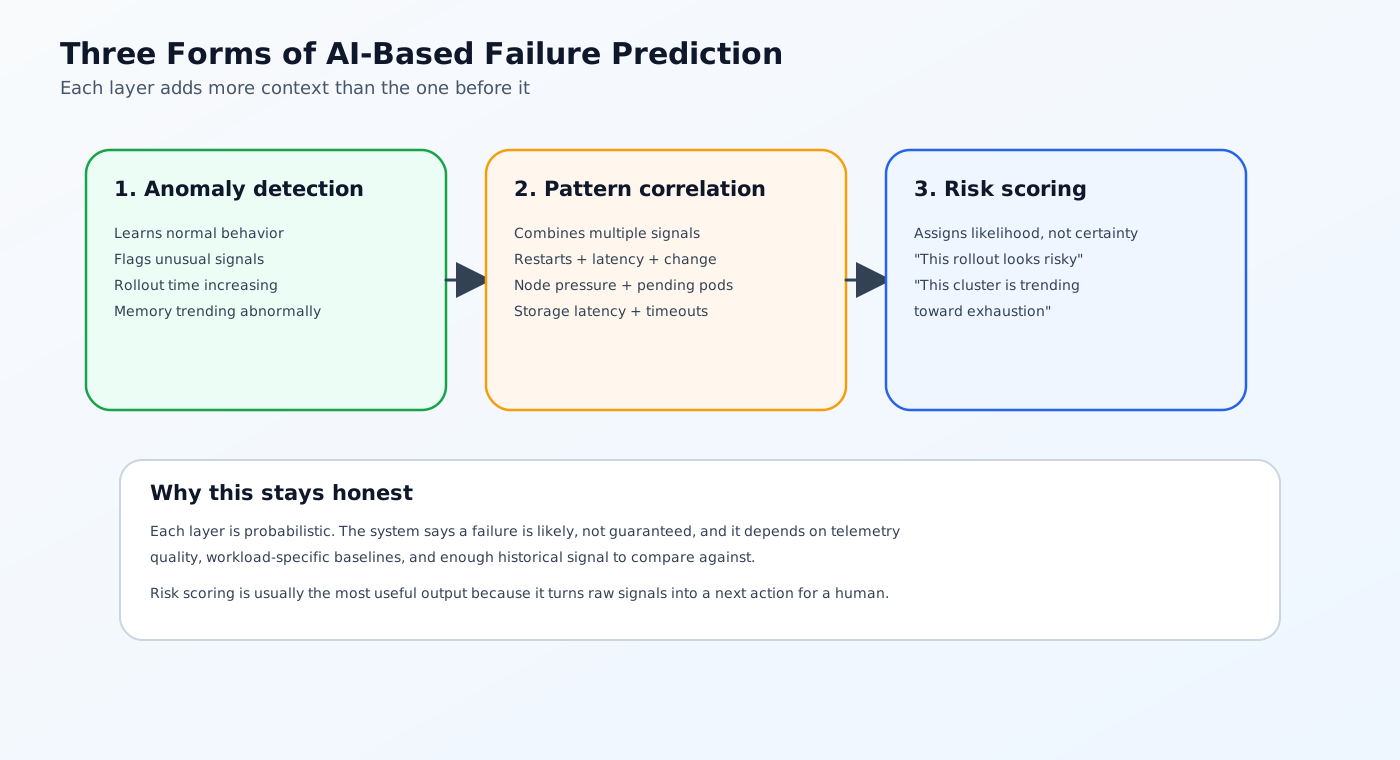
1. Anomaly detection
The system learns what normal behavior looks like and flags unusual signals.
Examples include:
- A rollout that is taking longer than the learned baseline
- A node whose memory usage keeps trending upward
- A namespace whose pod churn is increasing
2. Pattern correlation
The system compares multiple signals and looks for combinations that often show up before an incident.
For example:
- Pod restarts plus higher latency plus a recent image change
- Node pressure plus pending pods plus scheduling delays
- Storage latency plus application timeout errors
3. Risk scoring or early warning
Instead of claiming that an outage is guaranteed, the platform can say:
- This workload looks risky
- This rollout is trending in the wrong direction
- This cluster is moving toward resource exhaustion
That is the most useful version of prediction in real operations.
How the Analysis Works
An AI-assisted operations layer needs structured signals over time.
Signals it may analyze
- Pod restart counts
- Replica readiness
- Pending pod trends
- Deployment rollout duration
- CPU and memory saturation
- Node pressure
- Storage latency
- Network error patterns
- Control plane latency
- GitOps change history
Why Kubernetes is a good fit
Kubernetes already exposes enough state to compare change and behavior:
- Which workload changed
- Which node is affected
- Which namespace is impacted
- Which rollout is in progress
- Which resources are under pressure
That makes it a strong platform for early warning and guided response, even when the AI layer is only advisory.
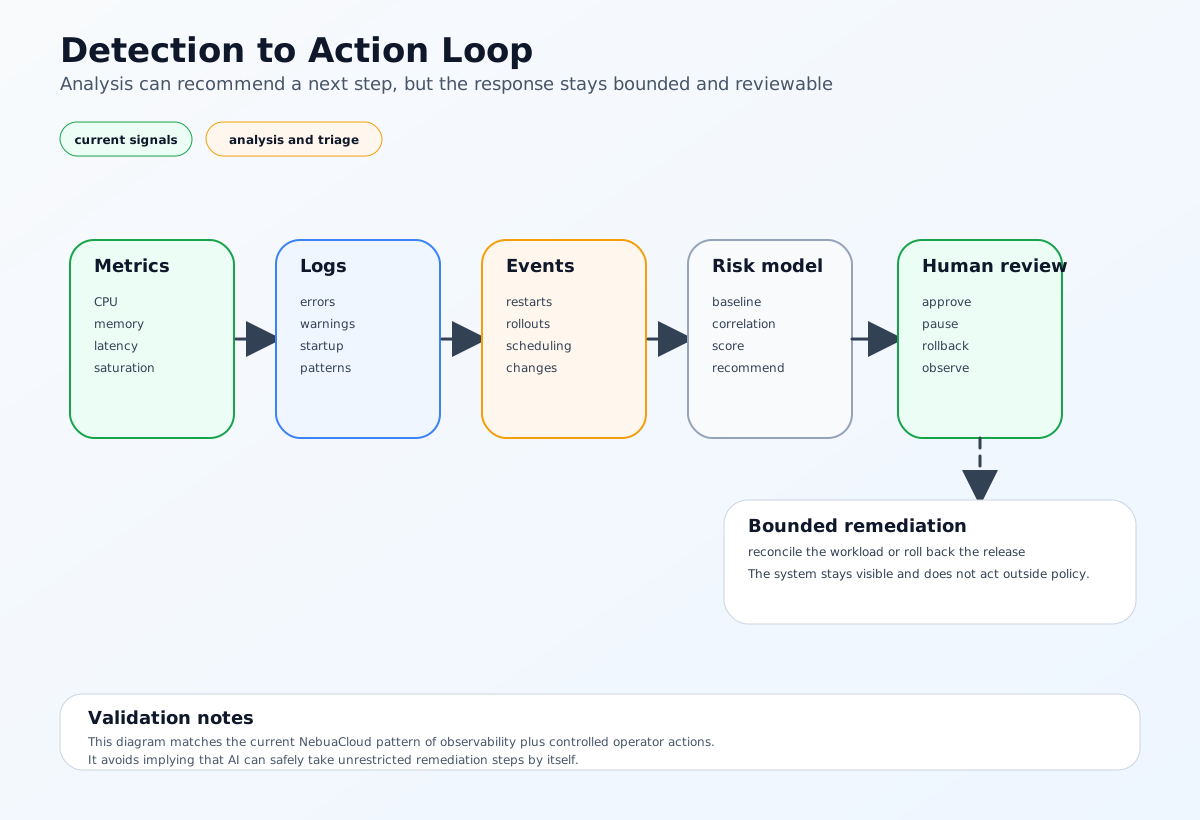
Common Approaches Teams Use Today
Most teams start with smaller, deterministic pieces rather than full prediction.
Rules-based alerts
The simplest approach is thresholding:
- Alert when CPU is high
- Alert when pod restarts exceed a limit
- Alert when latency crosses a threshold
This is useful, but it is reactive rather than predictive.
Time-series anomaly detection
Some systems learn baselines and flag deviations over time.
This can catch subtle changes before a hard threshold is reached.
Event correlation and root-cause assistance
Other systems connect alerts, logs, and events to identify the most likely source of the issue.
That helps teams decide whether the signal points to:
- A bad rollout
- A capacity issue
- A node problem
- A dependency failure
AIOps-style workflows
More advanced platforms combine telemetry analysis with guided response:
- Open an incident
- Recommend a rollback
- Suggest scaling
- Highlight the likely root cause
Limitations to Keep in Mind
AI can help, but it has important limits.
Prediction is probabilistic
The system can say something is likely, but not guarantee that it will happen.
False positives happen
If the model is too sensitive, it may warn about incidents that never happen.
Workloads differ
A model that works well for one service may be misleading for another with different traffic or resource patterns.
Data quality matters
If metrics, logs, or events are incomplete, the model cannot learn a good baseline.
Prediction alone does not fix the problem
Knowing that a failure is likely only helps if the platform can respond safely and quickly.
A Better Operational Model
The practical approach is to combine AI-assisted analysis with strong control.
1. Build observability first
Before prediction can work, teams need good data:
- Metrics
- Logs
- Events
- Traces
- Deployment state
2. Learn normal behavior per workload
Prediction works better when the system understands each cluster, namespace, or service separately.
3. Connect analysis to change history
If a risk signal appears right after a GitOps deployment, the system should know that the change is relevant.
GitOps still provides the reviewed desired state in Git. The analysis layer only compares telemetry and timing against that source of truth.
4. Keep humans in the loop
AI should recommend an action, not silently make risky changes.
5. Keep remediation bounded
The platform should know what it is allowed to do:
- Reconcile a workload
- Roll back a deployment
- Alert a team
- Scale a service
How NebuaCloud Fits Into This Model
This is where NebuaCloud fits naturally.
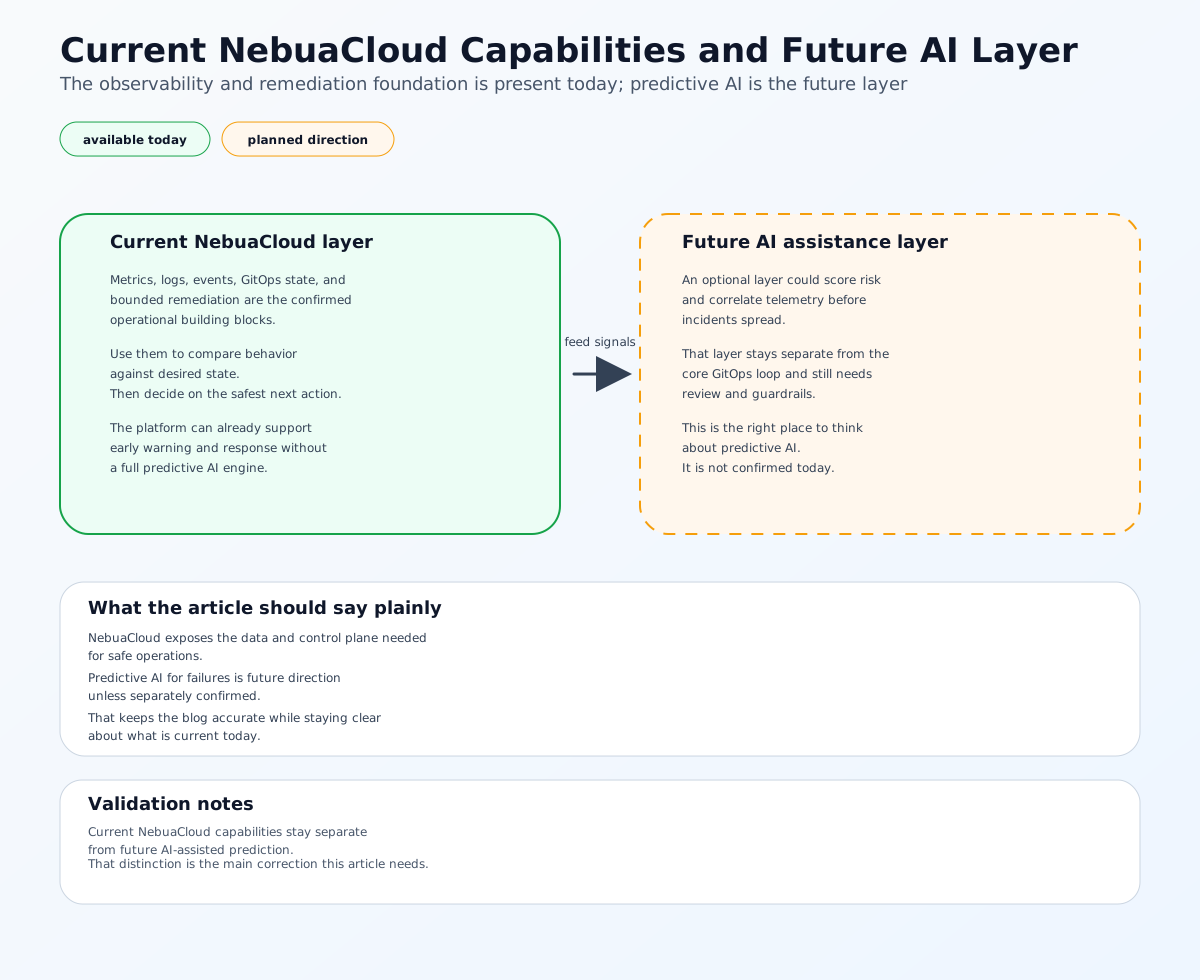
The current NebuaCloud docs and code reviewed for this article confirm observability, logs, events, GitOps status, and optional bounded remediation through the operator. That is the operational foundation an AI-assisted layer would need.
What is not confirmed as a current standard feature is a fully productized predictive AI engine that automatically knows a failure will happen before it happens.
What NebuaCloud already supports today
- Kubernetes and k3s management
- GitOps workflows
- Multi-tenant operational boundaries
- Metrics, logs, and event visibility
- Optional operator-based bounded remediation
What that means for this topic
NebuaCloud can surface the signals and response paths that make early warning useful, but the article should treat predictive AI failure detection as future direction unless the product ships a specific feature for it.
Practical Example: A Risky Rollout
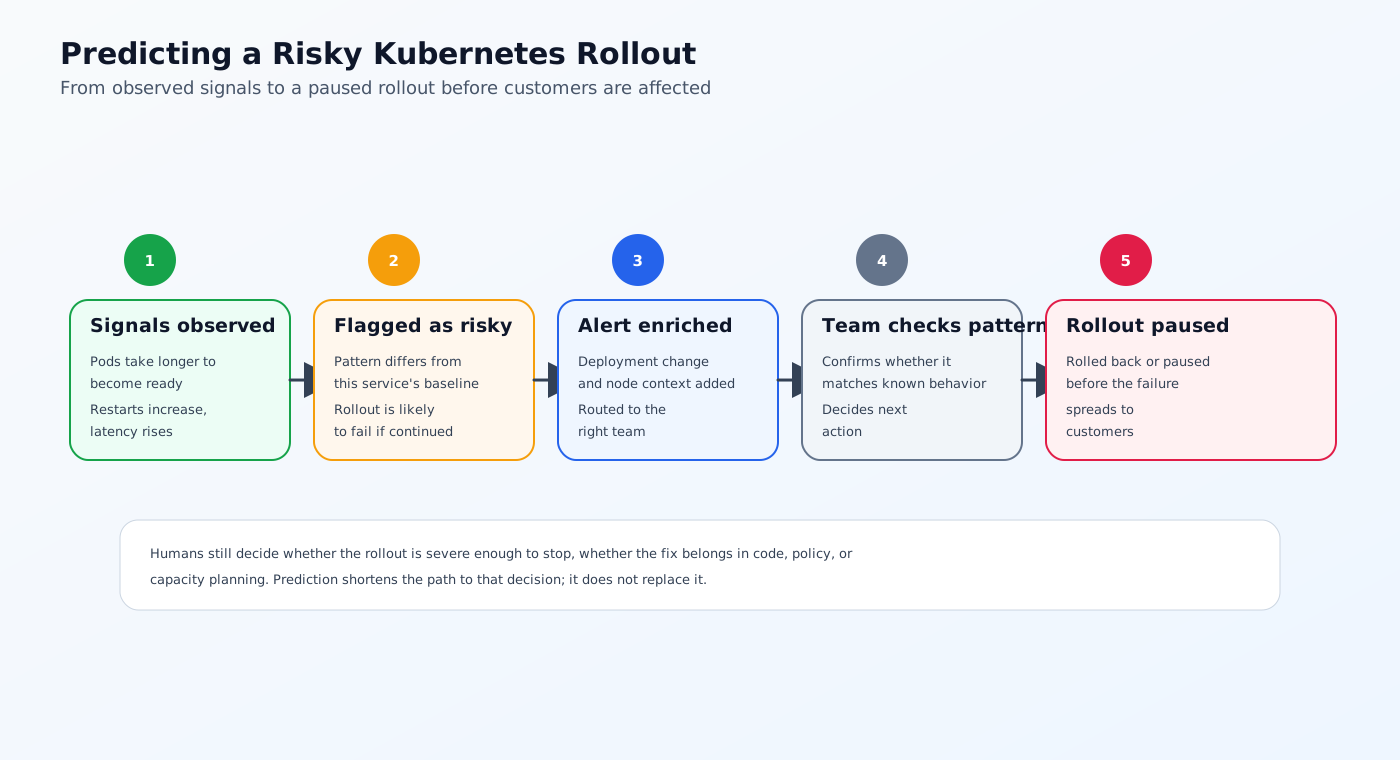
Imagine a Deployment is rolling out a new version of an API.
What the platform observes
- The new pods take longer to become ready than usual
- Restart counts increase during startup
- Latency rises for requests routed to the new version
- A node in the pool shows higher memory pressure
- The rollout is taking longer than the baseline for this service
What AI-assisted analysis can infer
From those signals, the platform may mark the rollout as risky and recommend a pause or rollback.
What happens next
- The system flags the rollout as high risk.
- The alert is enriched with recent deployment context.
- The team checks whether the issue matches a known pattern.
- The rollout is paused or rolled back before the failure spreads.
That is the practical value here: reducing the chance that the first sign of trouble is customer impact.
Conclusion
AI can help detect Kubernetes failures earlier by spotting warning patterns, correlating telemetry, and assigning risk before the outage becomes user-visible. That is real and useful, but it is not magic. The result depends on telemetry quality, workload-specific baselines, and safe remediation workflows.
For NebuaCloud, the confirmed foundation is observability, GitOps, multi-tenant operations, and bounded remediation. A fully productized predictive AI failure detector is not confirmed as a current standard capability in the reviewed product docs, so it should be treated as planned direction rather than current platform behavior.
Try it with NebuaCloud -> deploy in minutes
Current Availability
Note: NebuaCloud currently provides the operational signals and remediation hooks described in this article, including metrics, logs, events, GitOps state, and optional operator-based bounded remediation.
A fully integrated AI feature that predicts Kubernetes failures before they happen is not confirmed in the current product documentation reviewed for this post.
This article therefore treats predictive AI failure detection as future product direction. The current platform already supports the observability and control layer such a feature would need, but not the full predictive capability itself.