What Are the Best Practices for Kubernetes Monitoring?
Learn Kubernetes monitoring best practices for metrics, logs, alerts, health checks, and production observability across Kubernetes and k3s environments.
Kubernetes monitoring is not just about collecting metrics from nodes and pods. In production, monitoring is how teams answer the more important question: is the platform healthy enough to keep serving workloads safely?
That makes monitoring a core part of Kubernetes operations, not an optional add-on. Without good observability, issues such as node pressure, failing rollouts, storage latency, noisy neighbors, and control plane degradation can go unnoticed until they affect users.
This article explains Kubernetes monitoring best practices, compares the common observability approaches teams use today, highlights their limitations, and shows how a practical production model connects monitoring to GitOps, k3s, and multi-tenant operations.
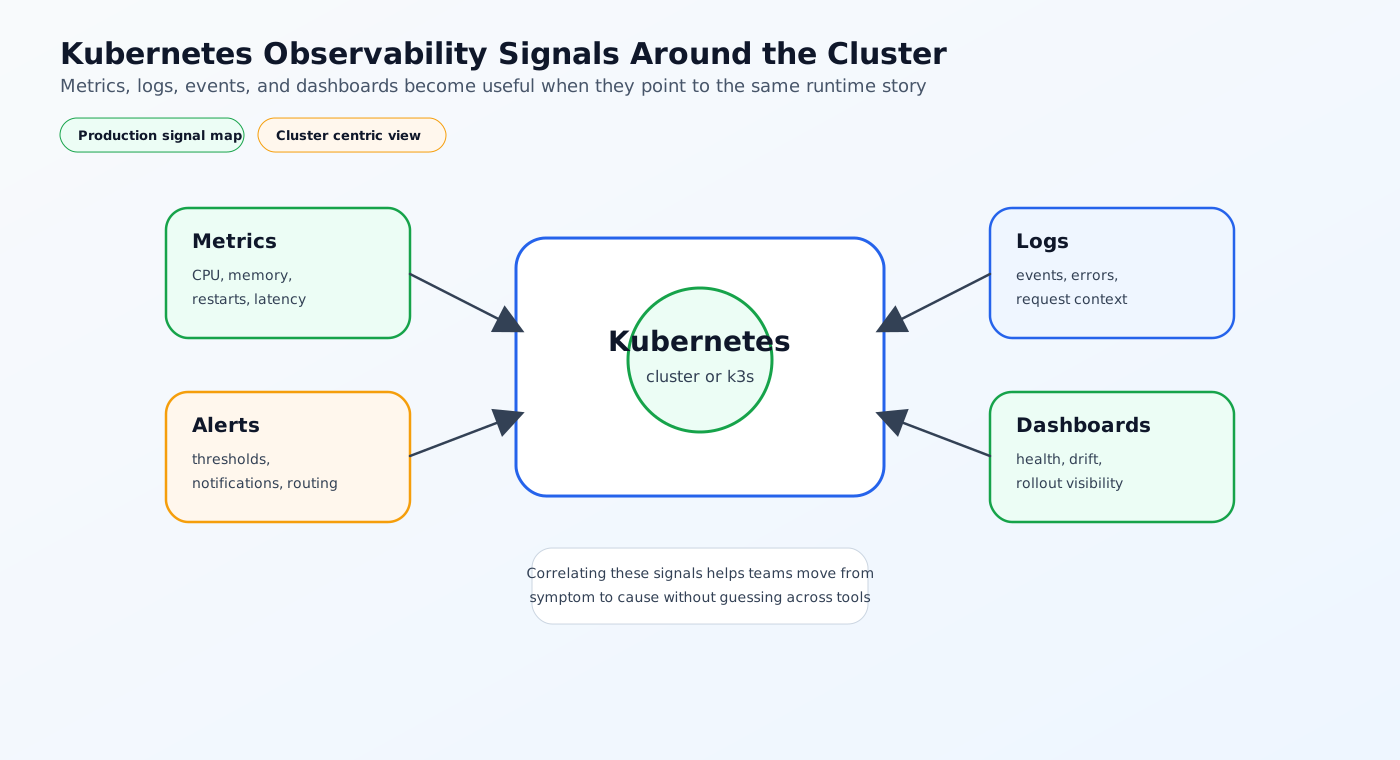
The Problem: Kubernetes Failures Are Often Spread Across Layers
One reason Kubernetes monitoring is hard is that failures do not usually stay in one place.
A slow application might actually be caused by:
- CPU or memory pressure on the node
- A bad image rollout
- DNS or service discovery problems
- Persistent volume latency
- Network policy misconfiguration
- A controller that is failing to reconcile
That means you cannot monitor only the application or only the cluster. You need visibility across the full stack.
Why monitoring is different in Kubernetes
Traditional server monitoring often asks whether a machine is up.
Kubernetes monitoring has to answer more questions:
- Are pods restarting too often?
- Is the scheduler placing workloads correctly?
- Are the controllers maintaining the desired state?
- Is traffic reaching healthy replicas?
- Is the platform drifting from the desired configuration?
Good monitoring turns those questions into dashboards, alerts, and actionable signals.
The Main Layers of Kubernetes Monitoring
The most useful way to approach Kubernetes monitoring is by separating it into layers.
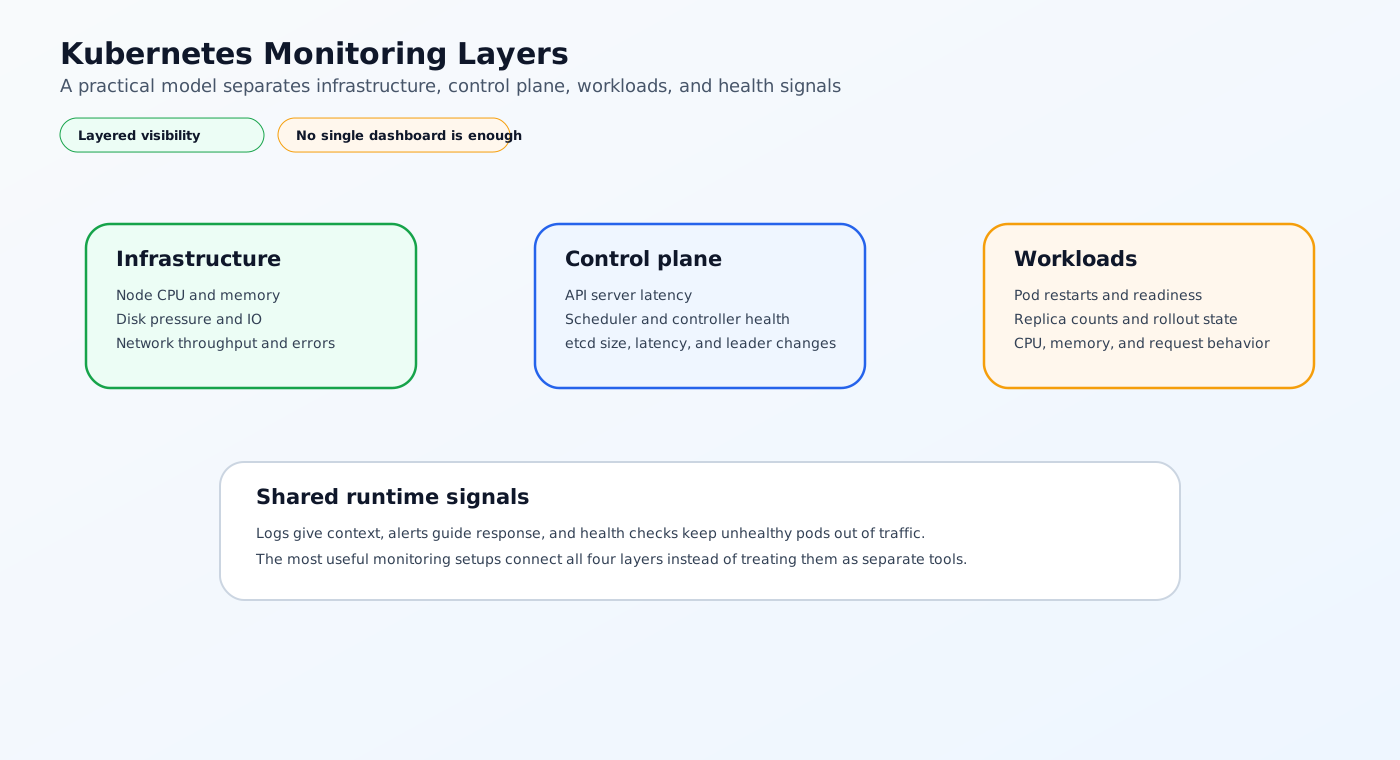
Infrastructure metrics
These are the basics:
- Node CPU and memory usage
- Disk pressure and filesystem usage
- Network throughput and errors
- Container runtime health
Infrastructure metrics help you catch underlying capacity or hardware issues before they affect workloads.
Cluster control plane metrics
The control plane is the brain of the cluster, so it needs monitoring too.
Watch for:
- API server latency and request volume
- Scheduler health
- Controller manager behavior
etcdsize, latency, and leader changes
If the control plane is unhealthy, the cluster may still look partially functional while becoming unreliable for changes.
Workload metrics
These metrics focus on application behavior:
- Pod restarts
- CPU and memory usage per workload
- Request latency
- Error rates
- Replica counts and readiness
These signals help distinguish a platform issue from an application issue.
Logging
Logs provide context that metrics cannot always show.
In Kubernetes, logs should be collected from:
- Application containers
- System components
- Ingress controllers
- Policy engines
- Control plane services where available
Health checks
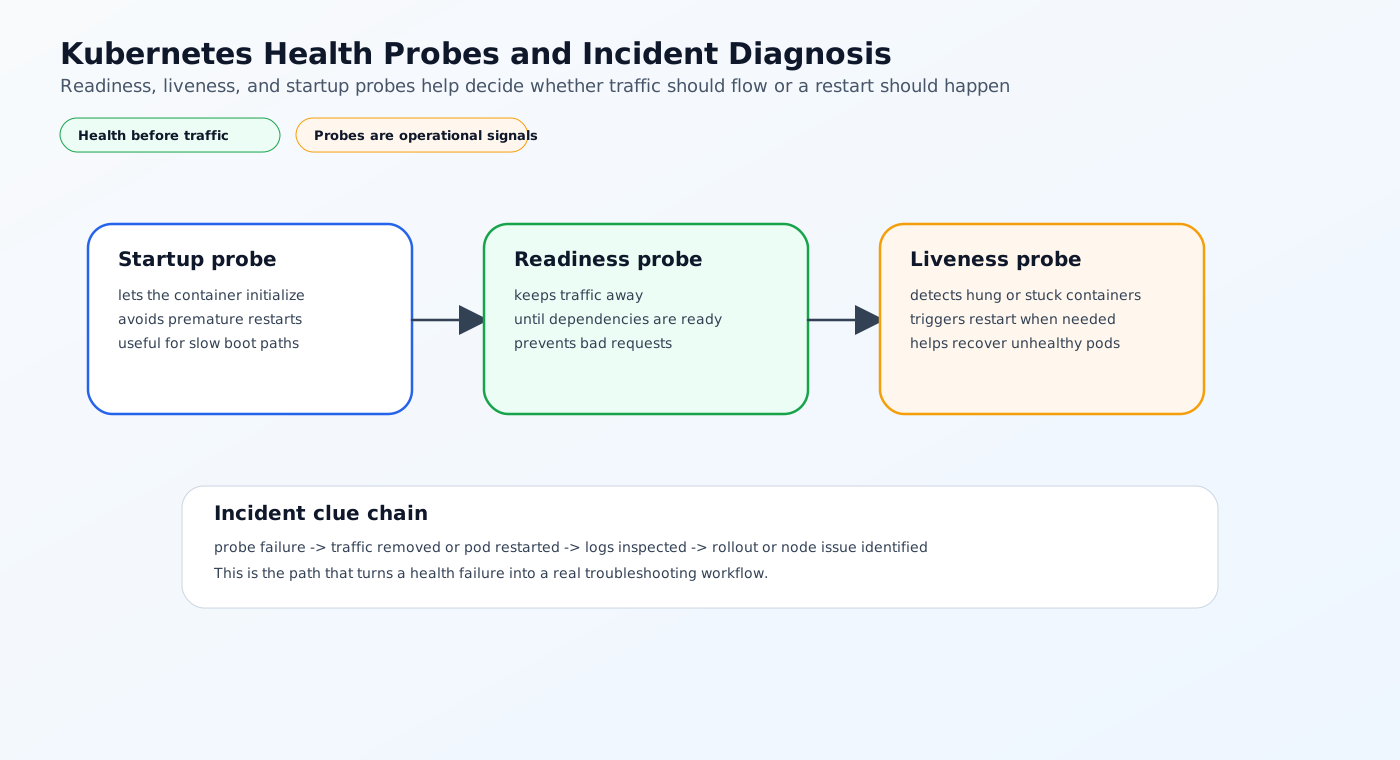
Health checks are not a replacement for observability, but they are essential.
- Readiness probes keep unhealthy pods out of traffic.
- Liveness probes recover containers that are stuck.
- Startup probes prevent premature restarts during slow initialization.
What Good Kubernetes Monitoring Looks Like
Monitoring is useful only when it helps teams detect and resolve problems quickly.
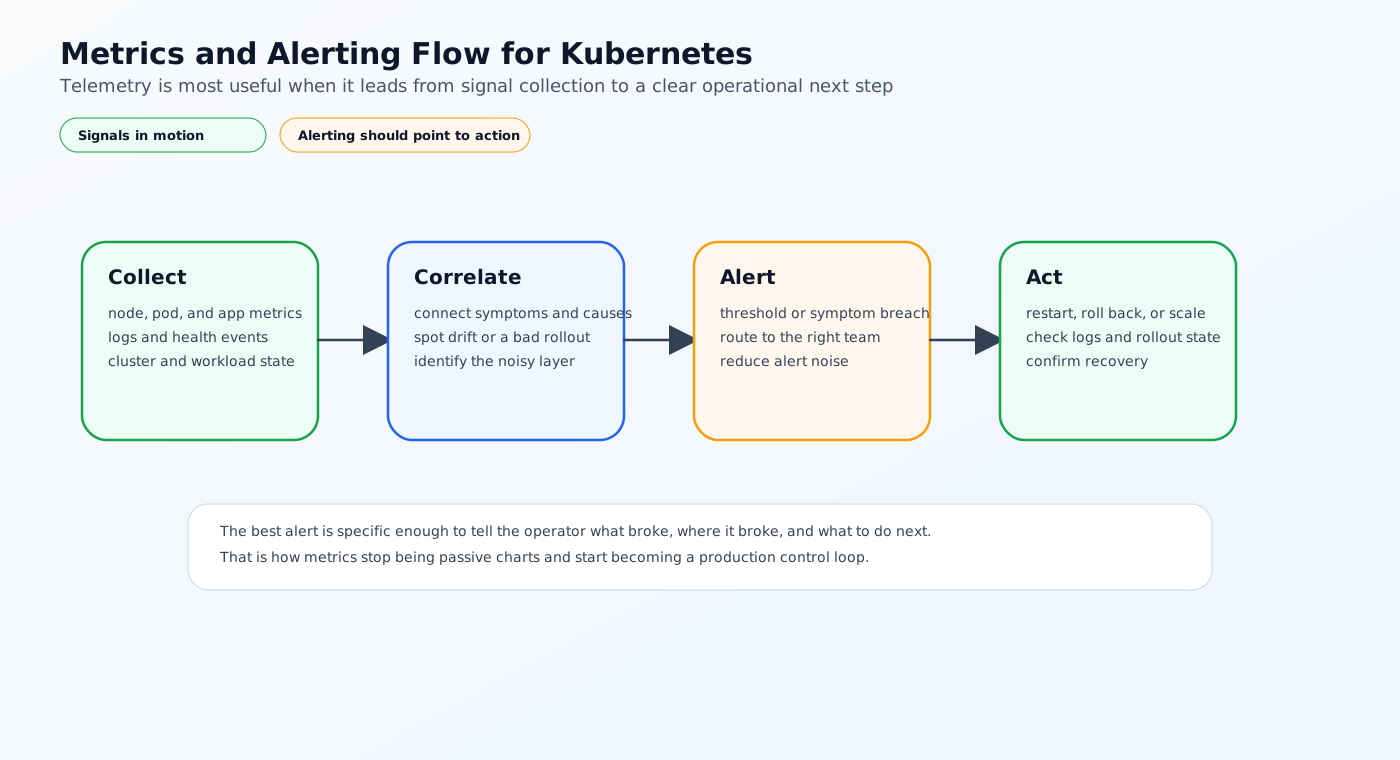
1. Monitor the cluster, not just the app
If you only monitor application dashboards, you can miss the underlying cause of a failure.
The cluster should expose visibility into:
- Node health
- Pod scheduling
- Resource pressure
- Control plane latency
- Storage behavior
2. Use meaningful SLO-oriented signals
Raw metrics are useful, but production teams usually need metrics tied to service behavior.
Good indicators include:
- Request success rate
- Latency percentiles
- Readiness failures
- Crash loops
- Replica availability
These signals are more actionable than generic "pod up/down" checks.
3. Alert on symptoms and causes
It is common to create too many alerts or too few.
Healthy monitoring usually includes both:
- Symptom alerts: user-facing error rates, high latency, failed rollouts
- Cause alerts: node pressure,
etcdissues, image pull failures, disk exhaustion
This helps teams diagnose both what the user sees and what the platform is experiencing.
4. Keep logs structured
Structured logs make it much easier to search by namespace, workload, request ID, or cluster.
Without structured logging, Kubernetes troubleshooting often becomes too slow during incidents.
5. Correlate metrics, logs, and events
Metrics tell you something is wrong. Logs tell you what happened. Events tell you what the cluster did.
When these three signals are connected, incident response becomes much faster.
Current Industry Standard Approaches
Most teams build Kubernetes observability from a combination of open-source and managed tooling.
Metrics collection
Common metrics stacks include:
- Prometheus for scraping and storage
- Grafana for dashboards
- Alertmanager for alert routing
- kube-state-metrics for workload state
- node-exporter for node-level visibility
This is the most common pattern for Kubernetes monitoring because it fits the cluster model well.
Logging pipelines
Teams usually centralize logs with tools such as:
- Fluent Bit
- Loki
- Elasticsearch and Kibana
- OpenSearch
- Cloud logging services
The key is consistency. Logs should be queryable across clusters and namespaces.
Tracing and service insight
For distributed systems, teams often add:
- OpenTelemetry
- Jaeger
- Tempo
Tracing is especially useful for microservices architectures and API chains.
Managed observability platforms
Some teams prefer managed observability platforms for lower operational overhead.
These tools are useful when the team wants faster setup and less maintenance, but they still need to be integrated into Kubernetes-specific workflows.
Limitations of Common Monitoring Setups
Monitoring stacks are powerful, but they often become incomplete or noisy.
Too much signal, not enough context
Teams can collect a lot of metrics and still miss the root cause because the signals are not connected.
Alert fatigue
If alerts are too broad or too frequent, engineers stop trusting them.
Cluster blind spots
Some setups watch applications well but ignore the control plane, storage, or scheduling layers.
Multi-cluster complexity
Once clusters multiply, dashboards and alerts often fragment across environments, which makes cross-cluster analysis harder.
k3s environments still need full observability
k3s reduces infrastructure weight, but it does not reduce the need for logging, metrics, and alerting.
Smaller clusters can still fail in exactly the same ways as larger ones.
A Practical Monitoring Strategy
A good Kubernetes monitoring model usually has four parts.
1. Define what "healthy" means
Before adding tools, decide what signals matter:
- API latency under threshold
- Pod readiness within expected time
- Error rate below target
- Replica availability above minimum
- Storage and node pressure within safe bounds
2. Collect the right signals
At minimum, capture:
- Node metrics
- Pod and container metrics
- Control plane metrics
- Application logs
- Kubernetes events
3. Connect alerts to action
Every alert should tell the on-call engineer what to do next.
Good alerts are specific:
- "Node disk pressure on
worker-3" - "Deployment
frontendhas unavailable replicas" - "API server latency exceeded threshold for 10 minutes"
4. Use dashboards for operational workflows
Dashboards should reflect the way the team investigates incidents, not just display every metric that exists.
That usually means:
- Cluster overview
- Namespace or team view
- Workload health view
- Rollout and deployment view
- Storage and network view
How NebuaCloud Fits Into This Model
Once the monitoring model is clear, the next problem is coordinating observability across multiple Kubernetes or k3s clusters, especially when GitOps and multi-tenant infrastructure are involved. That is where NebuaCloud fits naturally.
NebuaCloud is focused on Kubernetes management, GitOps workflows, multi-tenant infrastructure, and simplified deployment of production workloads. In a monitoring context, that means the platform can help bring together the operational signals that usually live across separate systems.
What this means in practice
NebuaCloud can help teams:
- Manage observability across Kubernetes and k3s clusters
- Surface live resource metrics and workload health
- Review logs alongside deployment state
- Support multi-tenant environments with clearer operational boundaries
- Reduce the overhead of watching many clusters through separate tools
This is useful when the real challenge is not collecting metrics, but making them actionable across the platform.
Practical Example: Monitoring a Production Deployment
Consider a web application deployed through GitOps into a Kubernetes cluster.
What the team monitors
- Pod readiness after rollout
- CPU and memory usage per replica
- Ingress latency and error rate
- Node pressure and storage capacity
- Controller reconciliation state
- Application logs for request failures
What happens during an incident
- A rollout completes, but latency increases.
- Metrics show that one node is under heavy memory pressure.
- Logs show that a downstream service is timing out.
- Health checks indicate that a pod is no longer ready.
- The team identifies the node and workload as the source of the problem.
Without multi-layer monitoring, that diagnosis would take much longer.
Conclusion
Kubernetes monitoring best practices start with a simple idea: do not monitor only the app, and do not monitor only the cluster.
You need visibility across infrastructure, control plane, workloads, logs, health checks, and alerts. You also need signals that guide action rather than create noise. In production, monitoring is only useful when it helps teams diagnose problems quickly and respond before users are affected.
For teams running Kubernetes and k3s at scale, NebuaCloud can provide a natural operational layer for GitOps, cluster management, multi-tenant infrastructure, and observability across environments.
Try it with NebuaCloud -> deploy in minutes
Current Availability
NebuaCloud already exposes real monitoring-related capabilities in the current codebase, including resource metrics, dashboard views, logs, alert events, and health-oriented workload context. That makes the article grounded in the platform's current direction.
At the same time, distributed tracing and advanced cross-service observability workflows are still broader industry patterns rather than fully visible product features today. The article treats those as best-practice guidance, not as a claim that NebuaCloud already ships every one of them as a finished end-to-end monitoring suite.